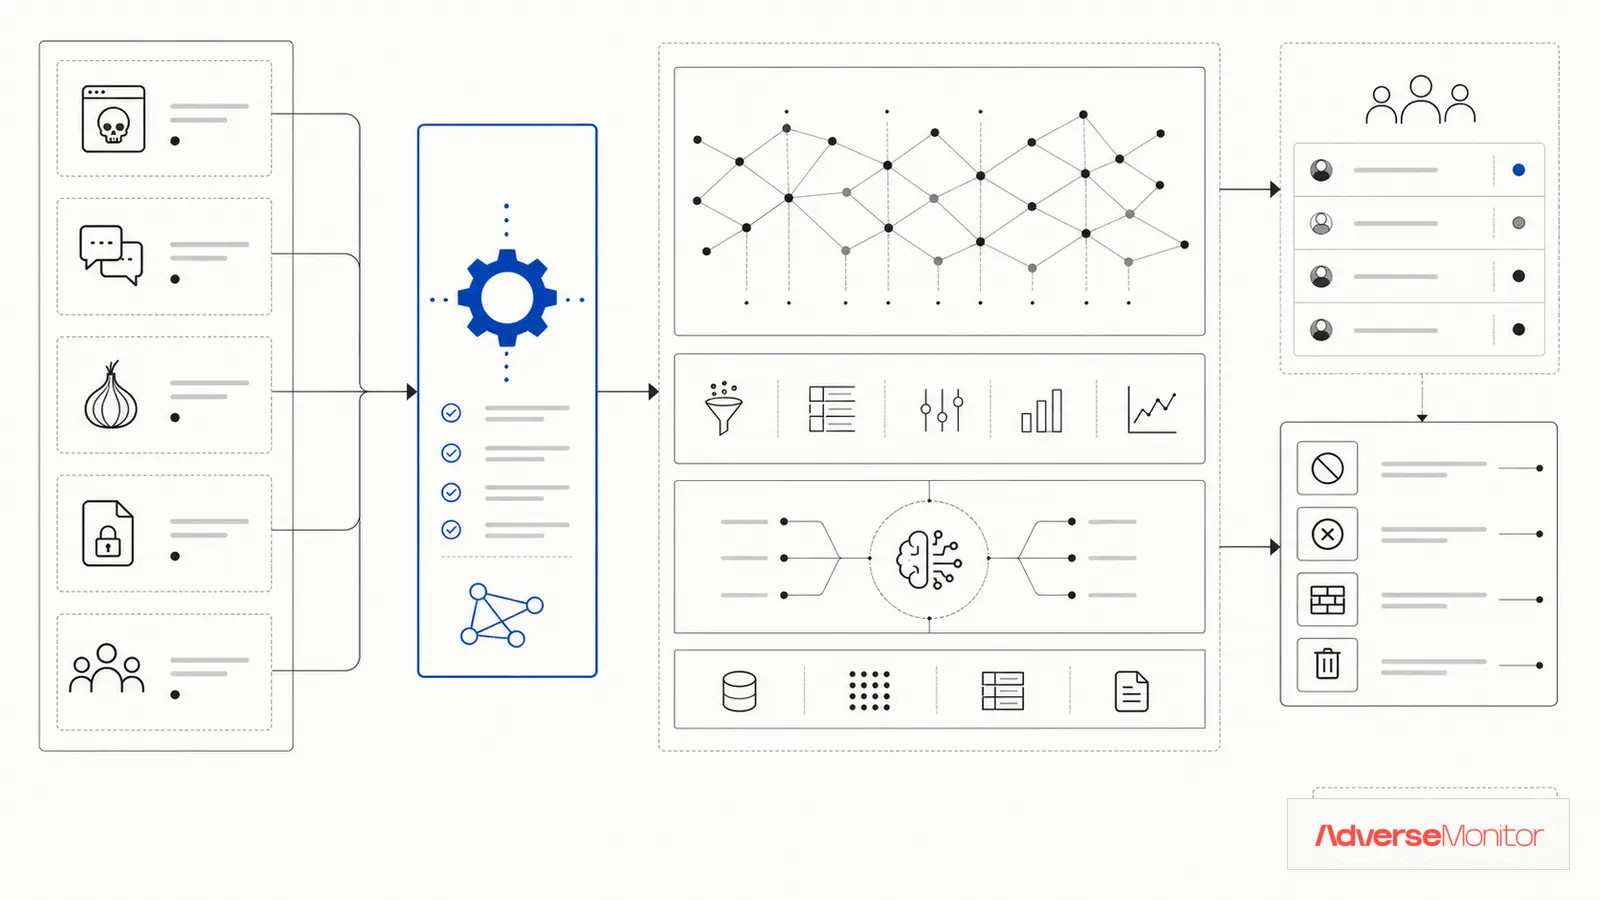
Your SIEM already holds authentication, endpoint, and network events. An external threat feed is easier to investigate when analysts can review it beside those records.
A dark web monitoring API can place matching source records in that same workflow. Analysts can then compare a record with internal evidence before opening or escalating an incident.
The examples below cover Splunk, Microsoft Sentinel, QRadar, and Elastic. They use the AdverseMonitor v1 API as documented on the API page: a bearer token in the Authorization header, the production base URL https://platform.adversemonitor.com/api/v1, and the read-only GET /threats route. Test the field mapping and delivery path in your own environment before sending production data.
Each record in the data array carries id, title, summary, category, threat_actors, a victims object with countries, industries, organizations, and domains arrays, risk_level, ai_analysis, and published_at. The meta object returns total, returned, the next cursor, and a filters_applied object that echoes the category, country, and since values the API used. Trial keys receive placeholder text in place of industries, organizations, domains, and ai_analysis; only countries is returned unchanged. Test with the key type you will run in production.
Why SIEM Integration Matters
Analysts lose time when they must check another dashboard and copy records by hand. A SIEM integration keeps the source record and the related internal event in one investigation queue.
SIEM integration solves this by:
- Centralizing alerts – Dark web threats appear alongside internal security events
- Enabling correlation – Match returned victim domains and organizations against asset inventory and authentication logs
- Automating response – Trigger playbooks when a record matches a monitored asset
- Improving metrics – Track how long a record takes to reach an analyst after the source published it
Integration Architecture Overview
Providers commonly expose one or both of these integration patterns:
1. Webhook (Push)
A provider sends a request to an endpoint you operate after it creates an eligible alert. Measure delivery time from collection through SIEM ingestion; a webhook alone does not guarantee real-time delivery.
2. Polling (Pull)
Your integration queries the API on a schedule. Polling gives you control over ingestion frequency and cursor handling, but you must account for rate limits and failed runs.
The documented AdverseMonitor v1 routes are read-only and pull-based, so every example in this article polls GET /threats. Check the API page for the current list of routes before designing around push delivery.
Choose by workflow: Use a webhook when the provider supports the event and you can operate a receiving endpoint. Use polling when your SIEM needs scheduled, cursor-based ingestion.
Splunk Integration
Splunk's HTTP Event Collector (HEC) accepts JSON events over HTTPS. Create a token, then test the polling script against a dedicated index.
Step 1: Create an HEC token
In Splunk, navigate to Settings → Data Inputs → HTTP Event Collector. Create a new token with a dedicated index for dark web data.
Step 2: Create an API key
Create or retrieve a key on the signed-in API Access page. Send it only in the HTTPS Authorization header, and keep both the API key and the HEC token in a secrets manager rather than in the script. The two requests the poller makes look like this:
# Read new records from AdverseMonitor
# since: ISO 8601 date or date-time with Z or a +HH:MM offset, for example 2026-01-15T12:00:00Z
GET https://platform.adversemonitor.com/api/v1/threats?limit=50&since=LAST_CHECKPOINT
Authorization: Bearer am_live_YOUR_KEY

# Write each record to Splunk
POST https://your-splunk:8088/services/collector/event
Authorization: Splunk YOUR_HEC_TOKEN
Step 3: Poll the threat list and forward to HEC
Use this Python script as a starting point. It requests records added since the last checkpoint, follows meta.cursor until the API returns null, and waits out a 429 using the retry_after value (in seconds) from the response body. Format since as an ISO 8601 date or date-time with a Z or +HH:MM suffix and no more than three fractional-second digits; a value the API cannot parse, including the six-digit microseconds Python's isoformat() emits, returns 400:
import time
from datetime import datetime, timedelta, timezone

import requests

DARKWEB_API = "https://platform.adversemonitor.com/api/v1/threats"
SPLUNK_HEC = "https://your-splunk:8088/services/collector/event"
API_KEY = "am_live_YOUR_KEY"
HEC_TOKEN = "your-hec-token"

# Replace with the last successful checkpoint from your state store.
# The API accepts at most three fractional-second digits, so format the
# value explicitly instead of calling isoformat().
since = (datetime.now(timezone.utc) - timedelta(hours=1)).strftime("%Y-%m-%dT%H:%M:%SZ")
cursor = None

while True:
    params = {"limit": 50, "since": since}
    if cursor:
        params["cursor"] = cursor

    response = requests.get(
        DARKWEB_API,
        headers={"Authorization": f"Bearer {API_KEY}"},
        params=params,
        timeout=10,
    )
    if response.status_code == 429:
        time.sleep(int(response.json().get("retry_after", 60)))
        continue
    response.raise_for_status()

    # Send each record to Splunk, keyed on the source publish time
    for threat in response.json()["data"]:
        published = datetime.fromisoformat(
            threat["published_at"].replace("Z", "+00:00")
        )
        event = {
            "time": published.timestamp(),
            "event": threat,
            "sourcetype": "darkweb:threat",
            "index": "darkweb_intel",
        }
        requests.post(
            SPLUNK_HEC,
            headers={"Authorization": f"Splunk {HEC_TOKEN}"},
            json=event,
            timeout=10,
        ).raise_for_status()

    cursor = response.json()["meta"]["cursor"]
    if not cursor:
        break
Step 4: Build correlation searches
Create Splunk searches that correlate the returned fields with internal data. The victims.domains array is the most direct match key; category and risk_level drive the priority of the result:
index=darkweb_intel sourcetype="darkweb:threat"
| spath path=victims.domains{} output=observed_domain
| mvexpand observed_domain
| join observed_domain [search index=authentication | rename src_domain as observed_domain | stats count by observed_domain]
| where count > 0
| table _time, category, title, risk_level, observed_domain, count
Microsoft Sentinel Integration
Microsoft Sentinel reads from a Log Analytics workspace. Send records to a custom table through the Azure Monitor Logs Ingestion API, which needs a data collection endpoint and a data collection rule (DCR). Do not build new work on the older HTTP Data Collector API. Microsoft's archived documentation states that support for it ended on September 14, 2026, that ingestion still functions, and that integrations should migrate to the Logs Ingestion API.
Option 1: Logic Apps
Create a Logic App that polls the API and ingests data into your Log Analytics workspace:
- Create a new Logic App with a Recurrence trigger and pick the interval against your plan's daily request limit on the plan table
- Add an HTTP action that calls
GET /threatswith the Authorization header, asincevalue from the last run, andlimit - Parse the JSON body and read the
dataarray andmeta.cursor - Post the records to your data collection endpoint through the Logs Ingestion API with an HTTP action that uses the Logic App's managed identity
Option 2: Azure Functions
For more control over field mapping and paging, use a timer-triggered Azure Function with the azure-monitor-ingestion package. The custom table in this example defines columns with the same names as the API fields:
import os
from datetime import datetime, timedelta, timezone

import azure.functions as func
import requests
from azure.identity import DefaultAzureCredential
from azure.monitor.ingestion import LogsIngestionClient

THREATS_URL = "https://platform.adversemonitor.com/api/v1/threats"
logs_client = LogsIngestionClient(
    endpoint=os.environ["DATA_COLLECTION_ENDPOINT"],
    credential=DefaultAzureCredential(),
)

def main(timer: func.TimerRequest) -> None:
    # Replace with the checkpoint from the previous run; follow meta.cursor
    # if a poll returns a full page. Keep since to whole seconds.
    since = (datetime.now(timezone.utc) - timedelta(minutes=15)).strftime("%Y-%m-%dT%H:%M:%SZ")
    api_response = requests.get(
        THREATS_URL,
        headers={"Authorization": f"Bearer {os.environ['ADVERSEMONITOR_API_KEY']}"},
        params={"limit": 50, "since": since},
        timeout=10,
    )
    api_response.raise_for_status()

    rows = [
        {
            "TimeGenerated": threat["published_at"],
            "id": threat["id"],
            "title": threat["title"],
            "category": threat["category"],
            "risk_level": threat["risk_level"],
            "threat_actors": threat["threat_actors"],
            "victim_domains": threat["victims"]["domains"],
            "published_at": threat["published_at"],
        }
        for threat in api_response.json()["data"]
    ]
    logs_client.upload(
        rule_id=os.environ["LOGS_DCR_RULE_ID"],
        stream_name="Custom-DarkWebThreats_CL",
        logs=rows,
    )
Analytics rules
Query the custom table with the same column names. Expand the domain array so one row per domain can be joined against sign-in or asset data:
DarkWebThreats_CL
| where TimeGenerated > ago(1h)
| where isnotempty(category)
| mv-expand domain = victim_domains
| project TimeGenerated, title, category, risk_level, tostring(domain), published_at
QRadar Integration
IBM QRadar can pull JSON from a REST API with the Universal Cloud REST API protocol and parse it with a log source extension:
Using a log source extension
- Create a log source that uses the Universal Cloud REST API protocol, with a workflow that calls
GET /threatswith the bearer header, asincevalue from the last run, andmeta.cursorfor paging - Write a log source extension that maps
title,category,risk_level, and thevictims.domainsarray to custom event properties - Set the event time from
published_atso QRadar orders records by source publish time - Create custom rules that fire when a mapped domain or organization matches a reference set of your own assets
Elastic Security Integration
Logstash's http_poller input can call GET /threats on a schedule. It does not follow meta.cursor, so keep limit at the documented maximum (100, or 50 for a trial key), pick a schedule that fits the daily request limit, and set the document id from the record id so overlapping polls update instead of duplicate. The five-minute schedule below makes 288 requests a day, which fits the Protection plan's 1,000 daily requests on the plan table but not a trial key's 100. Use a script when one poll can return more than one page:
Logstash Configuration
input {
  http_poller {
    urls => {
      darkweb => {
        url => "https://platform.adversemonitor.com/api/v1/threats?limit=100"
        headers => { "Authorization" => "Bearer am_live_YOUR_KEY" }
      }
    }
    schedule => { cron => "*/5 * * * *" }
    codec => "json"
  }
}

filter {
  # One event per record in the data array
  split { field => "data" }
  date {
    match => ["[data][published_at]", "ISO8601"]
    target => "@timestamp"
  }
}

output {
  elasticsearch {
    hosts => ["https://your-elastic:9200"]
    index => "darkweb-threats-%{+YYYY.MM.dd}"
    document_id => "%{[data][id]}"
  }
}
Best Practices for SIEM Integration
1. Normalize Data Fields
Map the API fields to your SIEM's common information model. Keep the record id so a repeated poll updates the same event instead of creating a new one. This enables correlation with other data sources and consistent alerting.
2. Set Appropriate Severity Levels
Not every record deserves an incident. Start from the returned risk_level and category, then raise priority when a victims.domains or victims.organizations value matches an asset you own:
- Critical: A monitored domain or organization appears in
victimsand the category indicates ransomware or data exposure - High: A tracked actor appears in
threat_actorswith a victim in your industry - Medium: Industry or country match with no asset match
- Low: Historical references, records already reviewed
3. Avoid Alert Fatigue
Configure deduplication on the record id and aggregation by title. Repeat polls that return the same record should not open separate incidents.
4. Automate Response
Connect dark web alerts to your SOAR platform. Automate actions like:
- Opening a ticket and notifying the asset owner when a
victims.domainsentry matches - Adding matching
threat_actorsvalues to a watchlist used by your other detections - Attaching the record
idandsummaryto the case so an analyst can open the detail route - Notifying affected business units
5. Maintain API Health
Monitor the integration for failures. Alert on 400 responses (a since or cursor value the API rejected), 401 responses (expired or revoked keys), 403 responses (plan or data window restrictions), 429 responses, and polls that return no records for longer than you expect. Trial keys also return an X-Trial-Expires header you can watch.
Verify the Available Records First
Check one domain against the current index and review the available records before deciding whether a scheduled API integration fits your workflow. AdverseMonitor does not check whether a specific email address or credential was exposed.
Check a DomainTroubleshooting Common Issues
API Rate Limiting
If the API returns 429, the JSON body includes retry_after in seconds, and every response carries X-RateLimit-Limit, X-RateLimit-Remaining, and X-RateLimit-Reset headers. Pause the poller for that interval before retrying and add bounded exponential backoff for other transient errors. Per-minute and per-day limits depend on the plan; see the plan table before choosing a polling interval.
Data Format Mismatches
Ensure your SIEM parser handles the JSON structure: data is an array of records, threat_actors and each list under victims are arrays, and meta.cursor is an opaque string or null. The cursor is null when a page returns fewer records than limit; a full page always returns a cursor, so expect one final empty page when the total is an exact multiple of limit. Test with sample data before production deployment.
Missing Historical Data
Use the documented since parameter and meta.cursor to collect the history available to your subscription. Records outside your plan's data window are not returned by the list route, and the detail route answers 403 for them. Store the last successful cursor or since value so a failed run does not create a gap.
Redacted Fields on Trial Keys
Trial keys return placeholder text instead of victims.industries, victims.organizations, victims.domains, and ai_analysis. A correlation search on victims.domains will not match anything on a trial key. Validate the integration with the key type you will run in production.
Measuring Integration Success
Track these metrics to validate your integration:
- Mean Time to Detect (MTTD): How quickly do dark web threats appear in your SIEM?
- Alert Volume: Are you getting actionable alerts without noise?
- Correlation Rate: What percentage of dark web alerts match internal events?
- Response Time: How quickly does your team act on dark web intelligence?
Conclusion
A SIEM integration gives analysts one place to compare an external source record with internal telemetry. Correlation rules still need explicit field mappings, thresholds, and owners.
The HTTP request is the small part. Plan time for parser tests, retry behavior, correlation rules, and an analyst runbook.
Start with one narrow query and review the returned evidence. Expand the integration only after the team can measure false matches, ingestion failures, and investigation time.